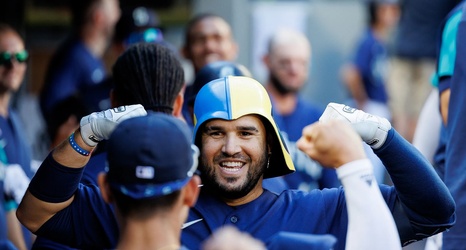
You can look at the chart if you like, but this is the best visual of this game:
Game thread comment of the day:
Honorable mention comment of the day:
:no_upscale()/cdn.vox-cdn.com/uploads/chorus_asset/file/24003968/Screen_Shot_2022_09_07_at_4.52.05_PM.png)
Ok ok the chart, since you insist:
:no_upscale()/cdn.vox-cdn.com/uploads/chorus_asset/file/24003967/Screenshot_2022_09_07_185017.png)
Spring in Chicago: Eugenio Suarez (.334 WPA)
Any other season in Chicago: Luis Castillo (-.498 WPA) BUT he also set the franchise record for most consecutive strikeouts to open a game and also fell victim to erroneous shenanigans.
