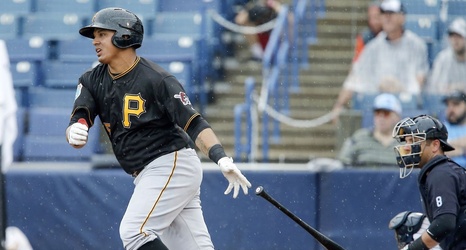
I got a little curious how much playing time teams give to crappy players, so I decided to add it up. I used plate appearances and, for pitchers, batters faced. I looked only at the NL because, at least in theory, the DH should allow teams to minimize their use of the fringes of their rosters. So comparing the Pirates to the AL wouldn’t be apples to apples. My definition of “crappy” was an OPS+ or ERA+ below 80. I like these two measures because they’re park-adjusted. I didn’t use more advanced metrics, like xFIP, because I wanted to look at actual results, not more predictive measures.
Bucco breakfast: How much playing time did the Pirates give to bad players?
