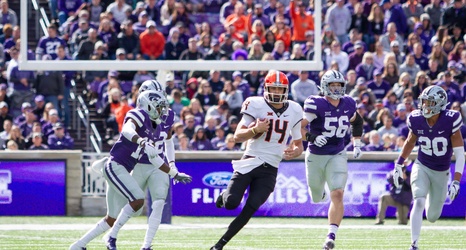
Oklahoma State’s offensive statistics show a startling drop in efficiency since they started Big 12 play. This is all despite averaging 13 drives per game over this season and still being third in the conference in points per game. Here’s a table showing their successful drive percentage up to this point in the season.
| Opponent | Successful Drives / Total Drives (*not counting kneeling possessions) | Successful Drive Percentage | Game Result |
| Missouri State | 9/16 (8 TD, 1 FG) | 56.25% | W |
| South Alabama | 8/15 (6 TD, 2 FG) | 53% | W |
| Boise State | 7/10 (4 TD, 3 FG)* | 70% | W |
| Texas Tech | 3/12 (2 TD, 1 FG) | 25% | L |
| Kansas | 8/13 (6 TD, 2 FG)* | 61. |
