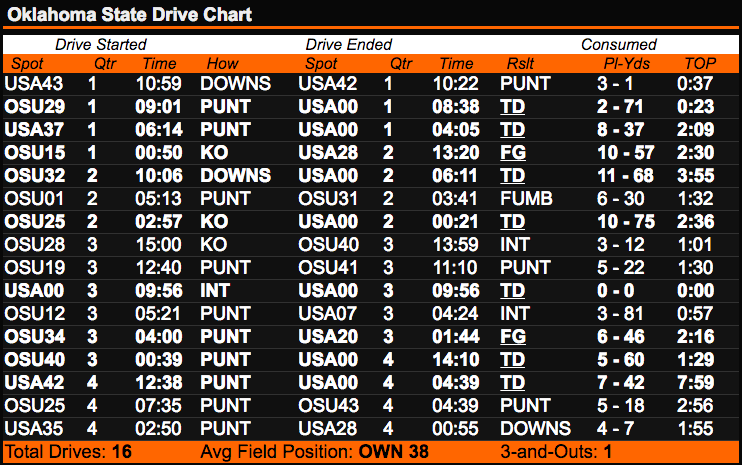
Oklahoma State pounded South Alabama 55-13 on Saturday evening in Stillwater, USA. It was a blowout by every measure of the word, despite a few bumps along the way (mostly on special teams). Now I’d like to look at whether it was as big of a blowout on paper as it was to watch. Let’s look at the drive charts for OSU and USA from Saturday.
OSU Drive Chart

Points per drive (offense): 3.2 (taking out the pick-six)
Yards per play: 7.2
Third-down conversions: 3/14 (21 percent)
Average starting field position: own 38-yard line
Red-zone scoring: 6/7 (5 touchdowns)
Points off turnovers: 7
Time of possession: 33:45
This looks really goo … wait, OSU was 3 for 14 on third downs?
