Drive charts and points scored per drive might just bore you right to tears, but I find this stuff fascinating. It matters because you can look at drive charts and PPD and determine “could that team score when it needed to, and could it get stops when it needed to.”
So let’s look at the two drive charts from Saturday’s game against Kansas and a few other deep statistics that mattered.
OSU Drive Chart
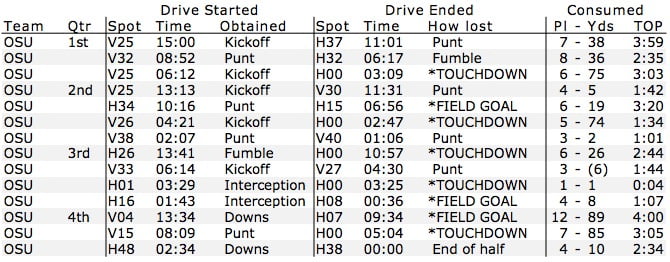
This started off pretty poorly. OSU went punt, fumble, TD and punt in its first four drives against one of the worst teams in FBS.