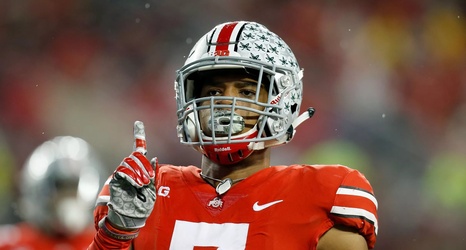
That went exactly how it should — Ohio State entered garbage time after just 16 plays by Illinois’ offense, mounting a 38-0 lead before half time. Illinois was the worst team on Ohio State’s schedule going by the S&P+ rankings, and well, the score reflected that. Ohio State had a +49% success rate:
OSU vs. Illinois
| Metric | Ohio State | Iliinois |
|---|---|---|
| Metric | Ohio State | Iliinois |
| Rushing SR | 65% | 14% |
| Rushing opp rate | 57% | 29% |
| Rushing exp plays | 17% | 0% |
| Rushing stuffed rate | 9% | 29% |
| Passing SR | 56% | 11% |
| Passing exp plays | 13% | 0% |
| Overall SR | 62% | 13% |
| Overall exp rate | 15% | 0% |
| 3rd down % | 57% | 0% |
| Red zone TDs | 100% | N/A |
| Scoring opps efficiency | 6. |
