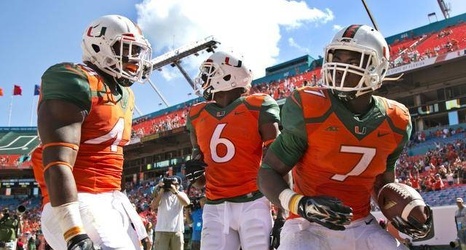
Last season I began to chart Miami Hurricanes football games. As it was the first year, there was some trial and error in getting the stats to the point I was happy with, but by season’s end I found a solid formula. This Article from last year breaks down those stats. Going into the 2015 season I knew some things were missing though. The easiest (and most obvious change), was adding down and distance to each play. After doing that, I realized success rate could be calculated very easily for every play, and from that, I could break out success rate by play type and even success rate for individual player touches.
Charting the Miami Hurricanes 2.0: Florida Atlantic Owls
