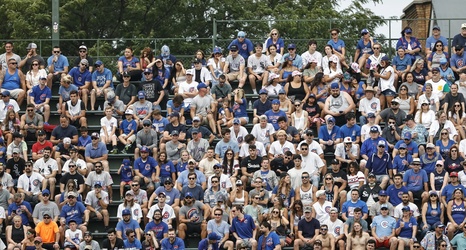
This article is going to compare Cubs attendance for the first 22 home dates of 2022, which is where we stand now, and for the first 22 home dates of the 2012-19 seasons. I’m skipping 2021, because the first 31 home dates last year were before Wrigley opened to full capacity, so a comparison is impossible.
Before I get started, there are several caveats to this data, which I’ll get to as we go along.
Here’s the average per-game attendance as announced by the Cubs for the first 22 home dates of each season from 2012-22, except 2020 (no fans) and 2021 (not at full capacity), plus the date range for each.
