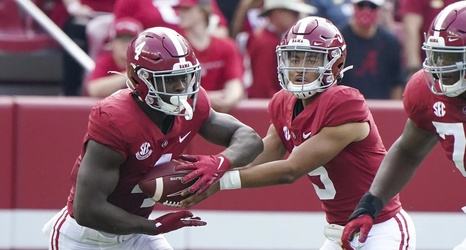
Well, it’s a normal-ish season again, so we have cupcake games back. Normally this would lead to some uninteresting graphs—the score was decisive enough to where the efficiency metrics tend to follow the trend—but we actually have some interesting ones this week (for better or for worse).
We’ll also take a look at some other points of comparison, including a few graphs from Oregon at Ohio State.
Not seeing any graphs below? Tap here to fix it.
Team SR and XR over time
I mean, by the time the game was out of reach — 31-0 at the half — you could call this a very decisive efficiency gap, too: the Alabama Crimson Tide didn’t have great efficiencies all day, but the defense had the Mercer Bears at a horrible ~15% SR late in the 2nd quarter.
